




Most small and mid-sized businesses don’t have a data problem. They have a visibility problem. The information exists in the accounting software, the CRM, the e-commerce platform, the scheduling tool, the ad accounts and a collection of spreadsheets but nobody can see it in one place, at the right time, in a form that leads to a decision.
So owners make calls based on gut feel, last month’s numbers or whichever report someone had time to build. By the time the month-end report reveals that margins slipped or a sales channel stalled, weeks of opportunity have passed.
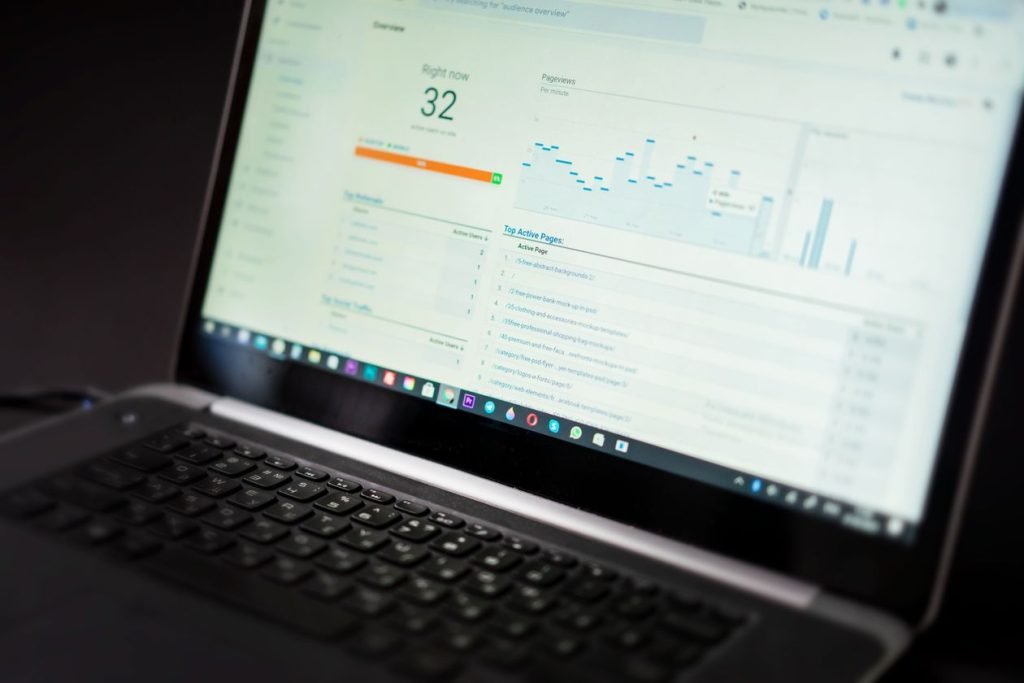
Business intelligence (BI) dashboards change that. A well-designed dashboard brings your most important numbers together, updates them automatically and shows what’s changing so you can act early. This guide explains what BI dashboards are, which KPIs matter for each part of a business, how to choose the right tools, how to design dashboards people actually use and how to implement them step by step.
Quick answer: A business intelligence dashboard is a visual display of a company’s key performance indicators that pulls data automatically from systems such as accounting, CRM, e-commerce and marketing platforms. Effective dashboards focus on a small number of decision-driving metrics, show targets and trends for context, use consistent definitions and refresh automatically so leaders can act quickly.
Key Takeaways
- Dashboards are valuable only when they lead to decisions; start with questions, not charts.
- Track a focused set of KPIs per audience — usually five to ten per dashboard.
- Consistent metric definitions matter more than sophisticated visuals.
- Connect your data sources so dashboards update automatically and eliminate manual reporting.
- Build a meeting rhythm around dashboards so insights become action.
What Is Business Intelligence?
Business intelligence is the combination of tools and practices that collect, organize, analyze and present business data to support decisions. It includes:
- Data sources: accounting, CRM, point of sale, e-commerce, marketing, operations, HR and spreadsheets
- Data integration: connecting and combining data from those sources
- Data modelling: defining how data relates and how metrics are calculated
- Visualization: dashboards and reports
- Analysis: exploring trends, causes and opportunities
Dashboards vs. reports
| Dashboard | Report | |
|---|---|---|
| Purpose | Monitor performance at a glance | Explain performance in detail |
| Format | Visual, concise, often interactive | Detailed tables, narrative, analysis |
| Frequency | Updated continuously or daily | Periodic: weekly, monthly, quarterly |
| Audience | Leaders and teams making ongoing decisions | Managers, boards, lenders, investors |
Most businesses need both: dashboards for day-to-day visibility and reports for deeper review.
Why Small Businesses Benefit From BI
- Faster decisions: see problems and opportunities in days instead of weeks.
- Less manual reporting: stop rebuilding the same spreadsheets every month.
- One version of the truth: everyone works from the same numbers and definitions.
- Accountability: teams can see their goals and progress.
- Better cash management: spot receivables, margin and spending issues early.
- Stronger conversations with lenders and investors: clear, reliable metrics build confidence.
Start With Decisions, Not Data
The most common dashboard mistake is starting with the data available and charting everything. Start instead with the questions leaders need to answer:
- Are we on track to hit this month’s revenue target?
- Which services or products are most profitable?
- Which marketing channels produce customers at an acceptable cost?
- Are we going to have enough cash next quarter?
- Where are projects or orders getting delayed?
- Which customers are at risk of leaving?
Each question becomes one or more KPIs, and each KPI should connect to an action someone can take.
KPIs by Department
| Department | Example KPIs | Decisions they support |
|---|---|---|
| Executive | Revenue vs. target, gross margin, net profit, cash balance, pipeline value | Overall priorities, investment and hiring |
| Finance | Cash runway, accounts receivable aging, days sales outstanding, gross margin by service, budget vs. actual | Collections, pricing, spending control |
| Sales | Pipeline by stage, win rate, average deal size, sales cycle length, revenue by rep | Coaching, forecasting, resource allocation |
| Marketing | Leads by channel, cost per lead, cost per acquisition, conversion rate, return on ad spend | Budget allocation, campaign optimization |
| Operations | Jobs completed, on-time delivery, utilization, backlog, rework rate | Scheduling, staffing, process improvement |
| Customer | Customer satisfaction, retention or churn, repeat purchase rate, reviews, support response time | Service improvements, retention efforts |
| E-commerce | Sessions, conversion rate, average order value, repeat customer rate, inventory turnover | Merchandising, promotions, purchasing |
| People | Headcount, turnover, overtime, revenue per employee | Hiring, workload, productivity |
Leading vs. lagging indicators
Lagging indicators, like revenue and profit, show results after they happen. Leading indicators, like qualified leads, pipeline value, booked appointments and website enquiries, predict future results. Good dashboards include both so you can act before outcomes are locked in.
Choosing the Right BI Tools
| Tool category | Examples | Strengths | Considerations |
|---|---|---|---|
| Built-in reporting | Dashboards inside accounting, CRM and e-commerce tools | Easy, no extra cost, real-time | Limited to one system’s data |
| Spreadsheet-based | Excel, Google Sheets with connectors | Familiar and flexible | Manual effort, error-prone, hard to scale |
| Self-service BI platforms | Microsoft Power BI, Looker Studio, Tableau, Zoho Analytics | Combine multiple data sources, interactive visuals, sharing | Requires setup, data modelling and governance |
| Open-source BI | Metabase, Apache Superset | Flexible and cost-effective | Technical setup and hosting required |
| Custom dashboards | Built into a client portal or internal application | Fully tailored, embedded where people work | Development investment |
How to choose
- Where your data lives: Microsoft-centric businesses often lean toward Power BI; Google Workspace and Google Ads users often start with Looker Studio.
- Number of data sources: More sources usually justify a dedicated BI platform and possibly a data warehouse.
- Users and sharing: Consider licensing, permissions and how dashboards will be shared.
- Skills: Choose a tool your team or partner can maintain.
- Security: Ensure the tool supports appropriate access controls for financial and customer data.
The BI Maturity Path
| Stage | What it looks like | Next step |
|---|---|---|
| 1. Manual spreadsheets | Reports built by hand each month | Define KPIs and connect key data sources |
| 2. Connected dashboards | BI tool pulls directly from a few systems | Standardize definitions and add more sources |
| 3. Centralized data | A data warehouse combines and cleans data from many systems | Add forecasting and deeper analysis |
| 4. Predictive and AI-assisted | Forecasts, anomaly alerts and natural-language questions | Embed insights into daily workflows |
Most small businesses get substantial value from stage 2. Move further when the number of sources, data volume or analysis needs justify it.
Designing Dashboards People Actually Use
One audience, one purpose
An owner’s dashboard and a sales manager’s dashboard answer different questions. Build separate views rather than one crowded page.
Put the most important numbers first
Place the top KPIs at the top left, where eyes naturally start. Use larger numbers for headline metrics and supporting charts below.
Always provide context
A number alone means little. Show comparisons to targets, the previous period or the same period last year.
Choose the right chart
- Line charts for trends over time
- Bar charts for comparing categories
- Tables for precise values and detailed lists
- Single-number cards for headline KPIs with comparisons
Avoid decorative charts that look impressive but slow understanding.
Use colour with purpose
Use colour to highlight exceptions such as a metric below target, rather than decorating every element. Don’t rely on colour alone to convey meaning; add labels or icons for accessibility.
Keep it uncluttered
Five to ten KPIs per dashboard is usually enough. If everything is highlighted, nothing is.
Data Quality and Governance
A dashboard is only as trustworthy as the data behind it.
- Create a metric dictionary that defines each KPI, its formula, data source and owner. For example, does “revenue” mean invoiced, collected or booked? Does a “lead” include spam submissions?
- Clean source data: standardize customer names, product categories and account codes.
- Fix processes at the source: if salespeople don’t update the CRM, the pipeline dashboard will be wrong.
- Control access: limit sensitive financial or employee data to the right people.
- Automate refreshes and monitor for failed data connections.
Financial Dashboards: Where to Start
For most small businesses, a financial dashboard delivers the fastest return. A strong starting set includes:
- Revenue vs. budget and prior year
- Gross margin by service, product or customer segment
- Operating expenses vs. budget
- Cash balance and a rolling cash forecast
- Accounts receivable aging and days sales outstanding
- Accounts payable due in the next 30 days
- Net profit trend
Connected to your accounting software, this dashboard replaces hours of manual month-end reporting and gives you early warning of cash pressure.
A Step-by-Step Implementation Plan
- Identify decisions and audiences. Who needs to know what, and how often?
- Choose KPIs for each audience and define them in a metric dictionary.
- Inventory data sources and assess data quality.
- Select tools based on data sources, users, skills and budget.
- Connect and model data, cleaning and combining sources as needed.
- Design a prototype dashboard and review it with users.
- Validate numbers against trusted reports before launch.
- Launch and train users on how to read and use the dashboard.
- Build a review rhythm: weekly team reviews, monthly leadership reviews.
- Iterate: retire unused metrics and add new ones as priorities change.
AI in Business Intelligence
AI is making BI more accessible. Many platforms now let users ask questions in plain language, generate summaries of what changed, detect anomalies automatically and assist with forecasting. These features are most useful when the underlying data is clean and definitions are consistent — AI amplifies good data foundations and exposes bad ones.
Common Dashboard Mistakes
- Tracking dozens of metrics with no clear purpose
- Vanity metrics that look good but don’t drive decisions
- Inconsistent definitions across teams
- No targets or comparisons
- Manual data refreshes that fall behind
- Dashboards built without input from the people who use them
- No meeting rhythm or ownership, so insights never lead to action
Frequently Asked Questions
Start with five to ten KPIs tied to your biggest decisions, typically revenue vs. target, gross margin, cash position, receivables, leads and conversion rates, plus a few operational metrics specific to your business.
It depends on your data sources and team. Power BI suits Microsoft-centric businesses, Looker Studio works well with Google tools and marketing data, and built-in dashboards may be enough if most data lives in one system.
Costs range from free or low-cost tools you set up yourself to professional implementations that include data integration, modelling and custom design. Licensing depends on the platform and number of users.
A focused dashboard using a few well-structured data sources can often be built within weeks. Projects requiring data cleanup, multiple integrations or a data warehouse take longer.
All KPIs are metrics, but not all metrics are KPIs. A KPI is a metric directly tied to a key business goal and used to guide decisions.
Not always. Many small businesses connect BI tools directly to a few systems. A data warehouse becomes valuable when you combine many sources, need historical consistency or run more complex analysis.
See Your Business Clearly — Every Day
When your most important numbers update automatically and appear in one place, decisions get faster, conversations get sharper and surprises get rarer. The best dashboards aren’t the most complex; they’re the ones that make the next decision obvious.
Netxeno builds BI dashboards and data integrations for small and mid-sized businesses across Canada, connecting accounting, CRM, e-commerce, marketing and operations data into clear, automated views. With finance expertise across our group through Solstice Partners, we design financial dashboards grounded in sound accounting practice. Book a free data and dashboard consultation at netxeno.com/.